Revizo / Microsoft / PL-300

MICROSOFT CERTIFICATION STUDY GUIDE

PL-300 practice questions.
Prepare with a clearer plan.

Demonstrates ability to analyze data and build reports using Power BI.

Download Revizo
Revizo certification practice question on iPhone

What to know about PL-300.

Demonstrates ability to analyze data and build reports using Power BI.

Format
Multiple choice questions
Duration
120 minutes
Passing score
700/1000
Recommended experience
1+ years of Power BI experience

Exam details are based on the available Microsoft catalogue information. Confirm current requirements with the exam provider before booking.

How to prepare for PL-300.

Use the provider's current objectives as your source of truth, then organise your Revizo sessions around the Microsoft technologies, product capabilities and implementation decisions named in the certification. The PL-300 exam is listed as Multiple choice questions; your starting point should reflect 1+ years of Power BI experience.

01

Map the official objectives.

Read the current Microsoft objectives and make a short list of the areas you need to revisit before booking PL-300.

02

Practise one area at a time.

Select PL-300 in Revizo and use focused question sessions to test one topic or decision type at a time, rather than relying on a single long cram session.

03

Review, then repeat.

Use your results to return to incorrect answers, revisit the official material behind them and repeat short PL-300 practice sessions until the gaps are clearer.

FREE PRACTICE PREVIEW

Read the first 20
PL-300 questions.

Review each question, its correct answer and any available source explanation before continuing your certification study in Revizo.

FIRST 20 QUESTIONS

Answers & available explanations

QUESTION 1

HOTSPOT -
You plan to create the Power BI model shown in the exhibit. (Click the Exhibit tab.)
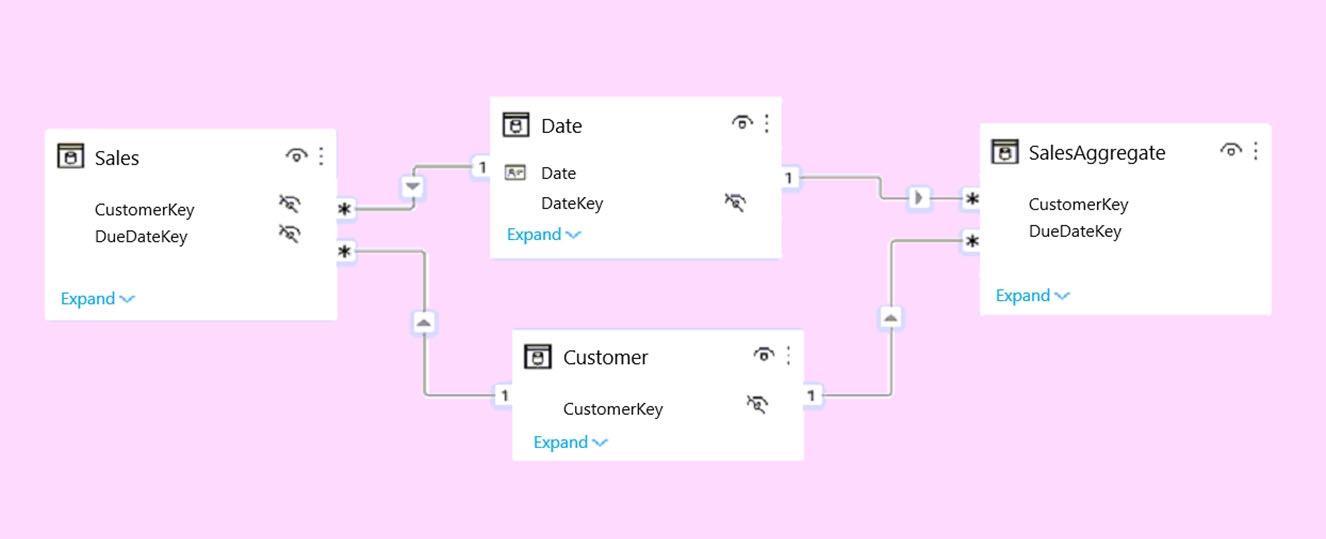
The data has the following refresh requirements:
✑ Customer must be refreshed daily.
✑ Date must be refreshed once every three years.
✑ Sales must be refreshed in near real time.
✑ SalesAggregate must be refreshed once per week.
You need to select the storage modes for the tables. The solution must meet the following requirements:
✑ Minimize the load times of visuals.
✑ Ensure that the data is loaded to the model based on the refresh requirements.
Which storage mode should you select for each table? To answer, select the appropriate options in the answer area.
NOTE: Each correct selection is worth one point.
Hot Area:
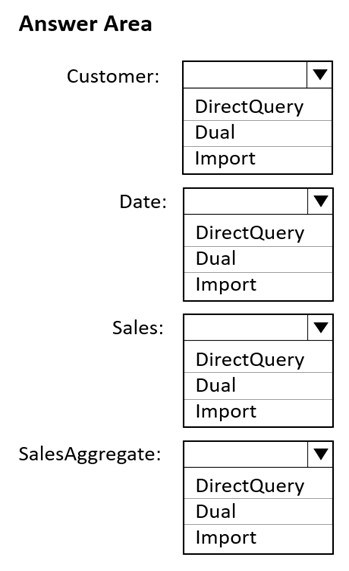
Item 1

  1. AA. DirectQuery
  2. BB. Dual
  3. CC. Import

Item 2

  1. AA. DirectQuery
  2. BB. Dual
  3. CC. Import

Item 3

  1. AA. DirectQuery
  2. BB. Dual
  3. CC. Import

Item 4

  1. AA. DirectQuery
  2. BB. Dual
  3. CC. Import
Show answer & explanation

Correct answer: Item 1: B · Item 2: B · Item 3: A · Item 4: C

ExplanationBox 1: Dual -
Customer should use the dual storage mode.
Dual: Tables with this setting can act as either cached or not cached, depending on the context of the query that's submitted to the Power BI dataset. In some cases, you fulfill queries from cached data. In other cases, you fulfill queries by executing an on-demand query to the data source.
Note: You set the Storage mode property to one of these three values: Import, DirectQuery, and Dual.

Box 2: Dual -
You can set the dimension tables (Customer, Geography, and Date) to Dual to reduce the number of limited relationships in the dataset, and improve performance.

Box 3: DirectQuery -
Sales should use the DirectQuery storage mode.
DirectQuery: Tables with this setting aren't cached. Queries that you submit to the Power BI datasetג€'for example, DAX queriesג€'and that return data from
DirectQuery tables can be fulfilled only by executing on-demand queries to the data source. Queries that you submit to the data source use the query language for that data source, for example, SQL.

Box 4: Import -
Import: Imported tables with this setting are cached. Queries submitted to the Power BI dataset that return data from Import tables can be fulfilled only from cached data.
Reference:
https://docs.microsoft.com/en-us/power-bi/transform-model/desktop-storage-mode

QUESTION 2

You have a project management app that is fully hosted in Microsoft Teams. The app was developed by using Microsoft Power Apps.
You need to create a Power BI report that connects to the project management app.
Which connector should you select?

  1. AA. Microsoft Teams Personal Analytics
  2. BB. SQL Server database
  3. CC. Dataverse
  4. DD. Dataflows
Show answer & explanation

Correct answer: C

ExplanationData sources in Power BI Desktop.
The Power Platform category provides the following data connections:

Power BI datasets -

Power BI dataflows -
Common Data Service (Legacy)

Dataverse -

Dataflows -
Other data sources include Microsoft Teams Personal Analytics (Beta).
Reference:
https://docs.microsoft.com/en-us/power-bi/connect-data/desktop-data-sources

QUESTION 3

For the sales department at your company, you publish a Power BI report that imports data from a Microsoft Excel file located in a Microsoft SharePoint folder.
The data model contains several measures.
You need to create a Power BI report from the existing data. The solution must minimize development effort.
Which type of data source should you use?

  1. AA. Power BI dataset
  2. BB. a SharePoint folder
  3. CC. Power BI dataflows
  4. DD. an Excel workbook
Show answer & explanation

Correct answer: A

ExplanationIt should be dataset, because the case states there is already a report published and the datamodel contains measures. therefore and to be able to use the measures in the datamodel you should connect to the existing dataset (which was created when you plublished the report) instead of starting from scratch with the files in the SharePoint folder.

QUESTION 4

You import two Microsoft Excel tables named Customer and Address into Power Query. Customer contains the following columns:
✑ Customer ID
✑ Customer Name
✑ Phone
✑ Email Address
✑ Address ID
Address contains the following columns:
✑ Address ID
✑ Address Line 1
✑ Address Line 2
✑ City
✑ State/Region
✑ Country
✑ Postal Code
Each Customer ID represents a unique customer in the Customer table. Each Address ID represents a unique address in the Address table.
You need to create a query that has one row per customer. Each row must contain City, State/Region, and Country for each customer.
What should you do?

  1. AA. Merge the Customer and Address tables.
  2. BB. Group the Customer and Address tables by the Address ID column.
  3. CC. Transpose the Customer and Address tables.
  4. DD. Append the Customer and Address tables.
Show answer & explanation

Correct answer: A

ExplanationA merge queries operation joins two existing tables together based on matching values from one or multiple columns. You can choose to use different types of joins, depending on the output you want.

Reference:
https://docs.microsoft.com/en-us/power-query/merge-queries-overview

QUESTION 5

HOTSPOT -
You have two Azure SQL databases that contain the same tables and columns.
For each database, you create a query that retrieves data from a table named Customer.
You need to combine the Customer tables into a single table. The solution must minimize the size of the data model and support scheduled refresh in powerbi.com.
What should you do? To answer, select the appropriate options in the answer area.
NOTE: Each correct selection is worth one point.
Hot Area:
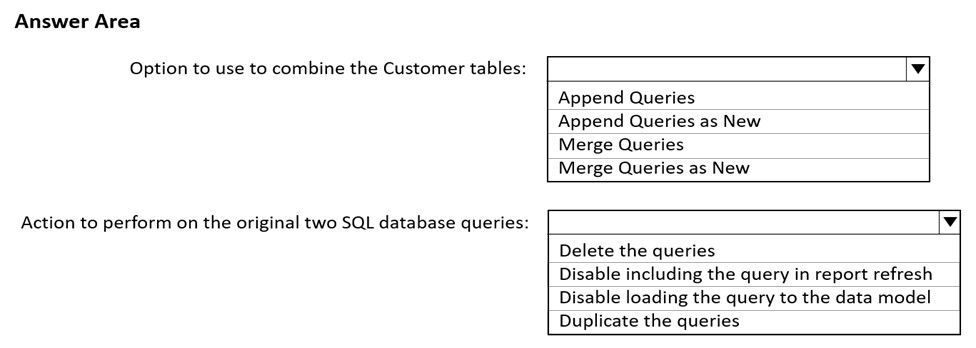
Item 1

  1. AA. Append Queries
  2. BB. Append Queries as New
  3. CC. Merge Queries
  4. DD. Merge Queries as New

Item 2

  1. AA. Delete the queries
  2. BB. Disable including the query in report refresh
  3. CC. Disable loading the query to the data model
  4. DD. Duplicate the queries
Show answer & explanation

Correct answer: Item 1: B · Item 2: C

ExplanationBox 1: Append Queries as New -
When you have additional rows of data that you'd like to add to an existing query, you append the query.
There are two append options:
* Append queries as new displays the Append dialog box to create a new query by appending multiple tables.
* Append queries displays the Append dialog box to add additional tables to the current query.
Incorrect: When you have one or more columns that you'd like to add to another query, you merge the queries.
Box 2: Disable loading the query to the data model
By default, all queries from Query Editor will be loaded into the memory of Power BI Model. You can disable the load for some queries, especially queries that used as intermediate transformation to produce the final query for the model.
Disabling Load doesn't mean the query won't be refreshed, it only means the query won't be loaded into the memory. When you click on Refresh model in Power
BI, or when a scheduled refresh happens even queries marked as Disable Load will be refreshed, but their data will be used as intermediate source for other queries instead of loading directly into the model. This is a very basic performance tuning tip, but very important when your Power BI model grows bigger and bigger.
Reference:
https://docs.microsoft.com/en-us/power-query/append-queries
https://radacad.com/performance-tip-for-power-bi-enable-load-sucks-memory-up

QUESTION 6

DRAG DROP -
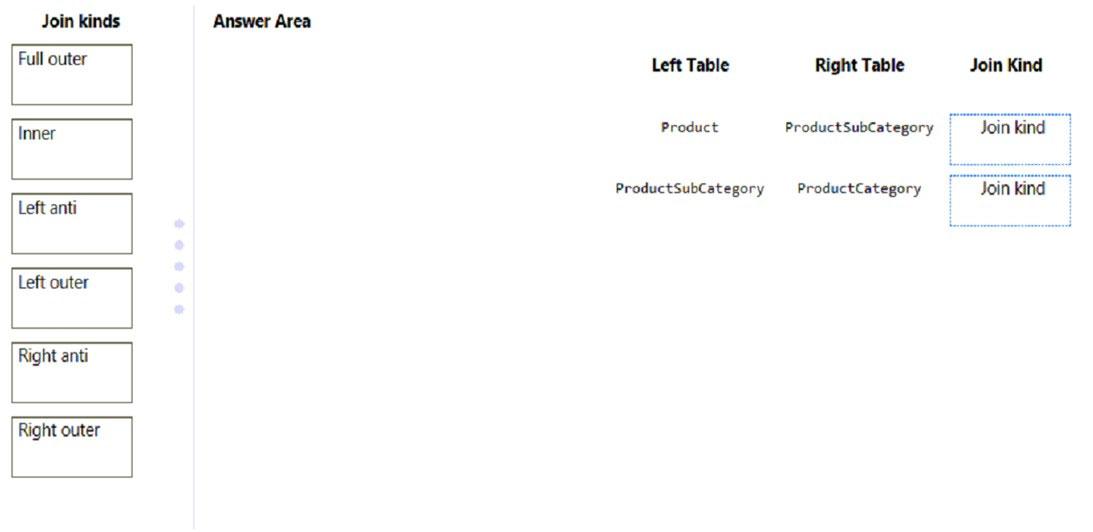
In Power Query Editor, you have three queries named ProductCategory, ProductSubCategory, and Product.
Every Product has a ProductSubCategory.
Not every ProductsubCategory has a parent ProductCategory.
You need to merge the three queries into a single query. The solution must ensure the best performance in Power Query.
How should you merge the tables? To answer, drag the appropriate merge types to the correct queries. Each merge type may be used once, more than once, or not at all. You may need to drag the split bar between panes or scroll to view content.
NOTE: Each correct selection is worth one point.
Select and Place:
Item 1

  1. AA. Full outer
  2. BB. Inner
  3. CC. Left anti
  4. DD. Left outer
  5. EE. Right anti
  6. FF. Right outer

Item 2

  1. AA. Full outer
  2. BB. Inner
  3. CC. Left anti
  4. DD. Left outer
  5. EE. Right anti
  6. FF. Right outer
Show answer & explanation

Correct answer: Item 1: B · Item 2: D

ExplanationBox 1: Inner -
Every Product has a ProductSubCategory.
A standard join is needed.
One of the join kinds available in the Merge dialog box in Power Query is an inner join, which brings in only matching rows from both the left and right tables.

Box 2: Left outer -
Not every ProductsubCategory has a parent ProductCategory.
One of the join kinds available in the Merge dialog box in Power Query is a left outer join, which keeps all the rows from the left table and brings in any matching rows from the right table.
Reference:
https://docs.microsoft.com/en-us/power-query/merge-queries-inner https://docs.microsoft.com/en-us/power-query/merge-queries-left-outer

QUESTION 7

You are building a Power BI report that uses data from an Azure SQL database named erp1.
You import the following tables.

You need to perform the following analyses:
✑ Orders sold over time that include a measure of the total order value
Orders by attributes of products sold

The solution must minimize update times when interacting with visuals in the report.
What should you do first?

  1. AA. From Power Query, merge the Order Line Items query and the Products query.
  2. BB. Create a calculated column that adds a list of product categories to the Orders table by using a DAX function.
  3. CC. Calculate the count of orders per product by using a DAX function.
  4. DD. From Power Query, merge the Orders query and the Order Line Items query.
Show answer & explanation

Correct answer: D

ExplanationA merge queries operation joins two existing tables together based on matching values from one or multiple columns.
Join the Orders and the Order Line Items tables.
Reference:
https://docs.microsoft.com/en-us/power-query/merge-queries-overview

QUESTION 8

You have a Microsoft SharePoint Online site that contains several document libraries.
One of the document libraries contains manufacturing reports saved as Microsoft Excel files. All the manufacturing reports have the same data structure.
You need to use Power BI Desktop to load only the manufacturing reports to a table for analysis.
What should you do?

  1. AA. Get data from a SharePoint folder and enter the site URL Select Transform, then filter by the folder path to the manufacturing reports library.
  2. BB. Get data from a SharePoint list and enter the site URL. Select Combine & Transform, then filter by the folder path to the manufacturing reports library.
  3. CC. Get data from a SharePoint folder, enter the site URL, and then select Combine & Load.
  4. DD. Get data from a SharePoint list, enter the site URL, and then select Combine & Load.
Show answer & explanation

Correct answer: A

ExplanationGet Data from SharePoint folder + select Combine & Load to load the data from all of the files in the SharePoint folder directly into your app.
Note: Connect to a SharePoint folder from Power Query Desktop
To connect to a SharePoint folder:
1. From Get Data, select SharePoint folder.
2. Paste the SharePoint site URL you copied in Determine the site URL to the Site URL text box in the SharePoint folder dialog box. In this example, the site URL is https://contoso.sharepoint.com/marketing/data. If the site URL you enter is invalid, a warning icon. warning icon will appear next to the URL text box.
SharePoint folder selection.
3. Select OK to continue.
4. If this is the first time you've visited this site address, select the appropriate authentication method. Enter your credentials and choose which level to apply these settings to. Then select Connect.
5. When you select the SharePoint folder you want to use, the file information about all of the files in that SharePoint folder are displayed. In addition, file information about any files in any subfolders is also displayed.
6. Select Combine & Transform Data to combine the data in the files of the selected SharePoint folder and load the data into the Power Query Editor for editing. Or select Combine & Load to load the data from all of the files in the SharePoint folder directly into your app.
Reference:
https://docs.microsoft.com/en-us/power-query/connectors/sharepointfolder

QUESTION 9

DRAG DROP -
You have a Microsoft Excel workbook that contains two sheets named Sheet1 and Sheet2.
Sheet1 contains the following table named Table1.

Sheet2 contains the following table named Table2.

You need to use Power Query Editor to combine the products from Table1 and Table2 into the following table that has one column containing no duplicate values.

Which three actions should you perform in sequence? To answer, move the appropriate actions from the list of actions to the answer area and arrange them in the correct order.
Select and Place:
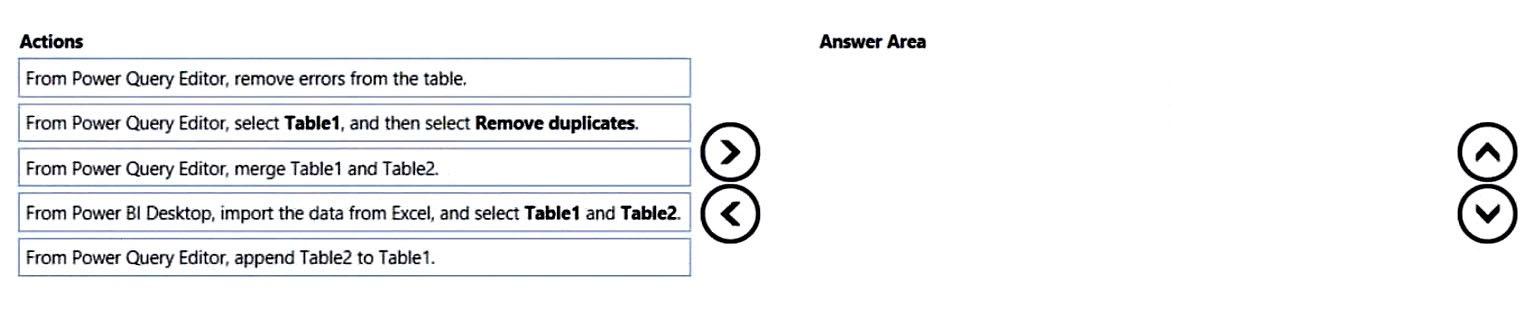
Item 1

  1. AA. From Power Query Editor, remove errors from the table.
  2. BB. From Power Query Editor, select Table1, and then select Remove duplicates.
  3. CC. From Power Query Editor, merge Table1 and Table2.
  4. DD. From Power BI Desktop, import the data from Excel, and select Table1 and Table2.
  5. EE. From Power Query Editor, append Table2 to Table1.

Item 2

  1. AA. From Power Query Editor, remove errors from the table.
  2. BB. From Power Query Editor, select Table1, and then select Remove duplicates.
  3. CC. From Power Query Editor, merge Table1 and Table2.
  4. DD. From Power BI Desktop, import the data from Excel, and select Table1 and Table2.
  5. EE. From Power Query Editor, append Table2 to Table1.

Item 3

  1. AA. From Power Query Editor, remove errors from the table.
  2. BB. From Power Query Editor, select Table1, and then select Remove duplicates.
  3. CC. From Power Query Editor, merge Table1 and Table2.
  4. DD. From Power BI Desktop, import the data from Excel, and select Table1 and Table2.
  5. EE. From Power Query Editor, append Table2 to Table1.
Show answer & explanation

Correct answer: Item 1: D · Item 2: E · Item 3: B

ExplanationD, E, B

QUESTION 10

You have a CSV file that contains user complaints. The file contains a column named Logged. Logged contains the date and time each complaint occurred. The data in Logged is in the following format: 2018-12-31 at 08:59.
You need to be able to analyze the complaints by the logged date and use a built-in date hierarchy.
What should you do?

  1. AA. Apply a transformation to extract the last 11 characters of the Logged column and set the data type of the new column to Date.
  2. BB. Change the data type of the Logged column to Date.
  3. CC. Split the Logged column by using at as the delimiter.
  4. DD. Apply a transformation to extract the first 11 characters of the Logged column.
Show answer & explanation

Correct answer: C

ExplanationAnswer C is best approach Split the Logged column by using "at" as the delimiter.

QUESTION 11

You have a Microsoft Excel file in a Microsoft OneDrive folder.
The file must be imported to a Power BI dataset.
You need to ensure that the dataset can be refreshed in powerbi.com.
Which two connectors can you use to connect to the file? Each correct answer presents a complete solution.
NOTE: Each correct selection is worth one point.

  1. AA. Excel Workbook
  2. BB. Text/CSV
  3. CC. Folder
  4. DD. SharePoint folder
  5. EE. Web
Show answer & explanation

Correct answer: D, E

ExplanationA, B, C: wrong! Would work technically, but the connection will be only to the local copy of the file, no refresh from the online version stored on OneDrive D: correct, but more complicated than option E E: correct, this is the best option to import from OneDrive

QUESTION 12

HOTSPOT -
You are profiling data by using Power Query Editor.
You have a table named Reports that contains a column named State. The distribution and quality data metrics for the data in State is shown in the following exhibit.

Use the drop-down menus to select the answer choice that completes each statement based on the information presented in the graphic.
NOTE: Each correct selection is worth one point.
Hot Area:
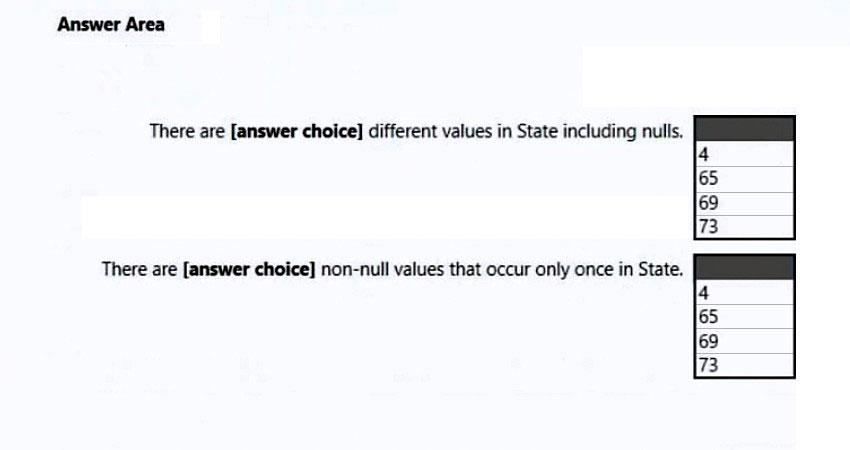
Item 1

  1. AA. 4
  2. BB. 65
  3. CC. 69
  4. DD. 73

Item 2

  1. AA. 4
  2. BB. 65
  3. CC. 69
  4. DD. 73
Show answer & explanation

Correct answer: Item 1: C · Item 2: A

ExplanationBox 1: 69 -
69 distinct/different values.
Note: Column Distribution allows you to get a sense for the overall distribution of values within a column in your data previews, including the count of distinct values (total number of different values found in a given column) and unique values (total number of values that only appear once in a given column).

Box 2: 4 -
Reference:
https://systemmanagement.ro/2018/10/16/power-bi-data-profiling-distinct-vs-unique/

QUESTION 13

HOTSPOT -
You have two CSV files named Products and Categories.
The Products file contains the following columns:
✑ ProductID
✑ ProductName
✑ SupplierID
✑ CategoryID
The Categories file contains the following columns:
✑ CategoryID
✑ CategoryName
✑ CategoryDescription
From Power BI Desktop, you import the files into Power Query Editor.
You need to create a Power BI dataset that will contain a single table named Product. The Product will table includes the following columns:
✑ ProductID
✑ ProductName
✑ SupplierID
✑ CategoryID
✑ CategoryName
✑ CategoryDescription
How should you combine the queries, and what should you do on the Categories query? To answer, select the appropriate options in the answer area.
NOTE: Each correct selection is worth one point.
Hot Area:
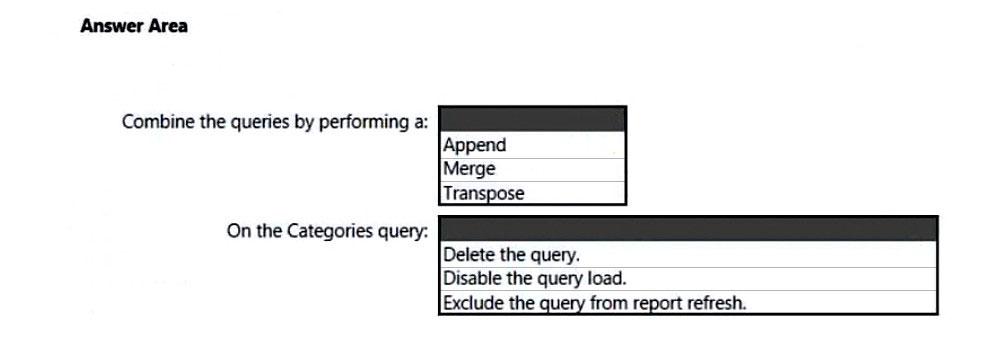
Item 1

  1. AA. Append
  2. BB. Merge
  3. CC. Transpose

Item 2

  1. AA. Delete the query.
  2. BB. Disable the query load.
  3. CC. Exclude the query from report refresh.
Show answer & explanation

Correct answer: Item 1: B · Item 2: B

ExplanationBox 1: Merge -
There are two primary ways of combining queries: merging and appending.
* When you have one or more columns that you'd like to add to another query, you merge the queries.
* When you have additional rows of data that you'd like to add to an existing query, you append the query.

Box 2: Disable the query load -

Managing loading of queries -
In many situations, it makes sense to break down your data transformations in multiple queries. One popular example is merging where you merge two queries into one to essentially do a join. In this type of situations, some queries are not relevant to load into Desktop as they are intermediate steps, while they are still required for your data transformations to work correctly. For these queries, you can make sure they are not loaded in Desktop by un-checking 'Enable load' in the context menu of the query in Desktop or in the Properties screen:
Reference:
https://docs.microsoft.com/en-us/power-bi/connect-data/desktop-shape-and-combine-data https://docs.microsoft.com/en-us/power-bi/connect-data/refresh-include-in-report-refresh

QUESTION 14

You have an Azure SQL database that contains sales transactions. The database is updated frequently.
You need to generate reports from the data to detect fraudulent transactions. The data must be visible within five minutes of an update.
How should you configure the data connection?

  1. AA. Add a SQL statement.
  2. BB. Set the Command timeout in minutes setting.
  3. CC. Set Data Connectivity mode to Import.
  4. DD. Set Data Connectivity mode to DirectQuery.
Show answer & explanation

Correct answer: D

ExplanationDirectQuery: No data is imported or copied into Power BI Desktop. For relational sources, the selected tables and columns appear in the Fields list. For multi- dimensional sources like SAP Business Warehouse, the dimensions and measures of the selected cube appear in the Fields list. As you create or interact with a visualization, Power BI Desktop queries the underlying data source, so you're always viewing current data.
Reference:
https://docs.microsoft.com/en-us/power-bi/connect-data/desktop-use-directquery

QUESTION 15

DRAG DROP -
You have a folder that contains 100 CSV files.
You need to make the file metadata available as a single dataset by using Power BI. The solution must NOT store the data of the CSV files.
Which three actions should you perform in sequence. To answer, move the appropriate actions from the list of actions to the answer area and arrange them in the correct order.
Select and Place:
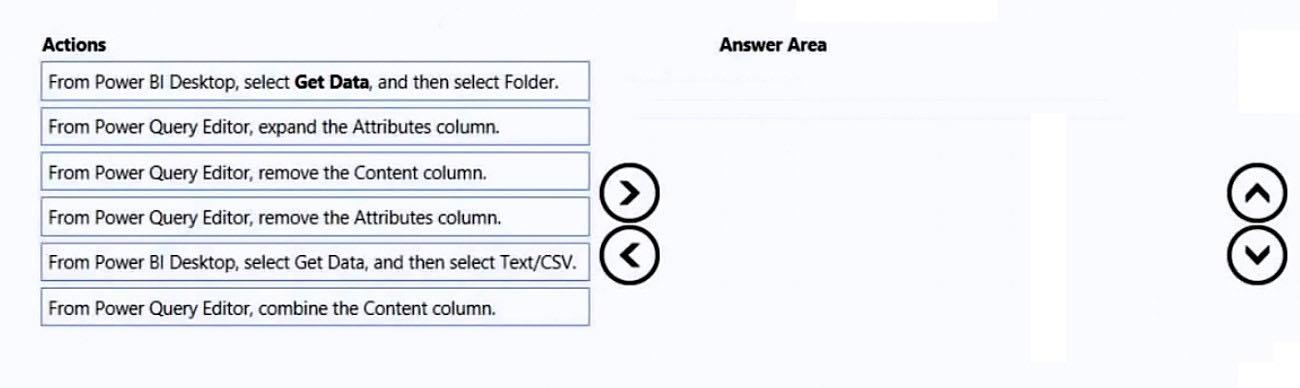
Item 1

  1. AA. From Power BI Desktop, select Get Data, and then select Folder.
  2. BB. From Power Query Editor, expand the Attribute column.
  3. CC. From Power Query Editor, remove the Content column.
  4. DD. From Power Query Editor, remove the Attribute column.
  5. EE. From Power BI Desktop, select Get Data, and then select Text/CSV.
  6. FF. From Power Query Editor, combine the Content column.

Item 2

  1. AA. From Power BI Desktop, select Get Data, and then select Folder.
  2. BB. From Power Query Editor, expand the Attribute column.
  3. CC. From Power Query Editor, remove the Content column.
  4. DD. From Power Query Editor, remove the Attribute column.
  5. EE. From Power BI Desktop, select Get Data, and then select Text/CSV.
  6. FF. From Power Query Editor, combine the Content column.

Item 3

  1. AA. From Power BI Desktop, select Get Data, and then select Folder.
  2. BB. From Power Query Editor, expand the Attribute column.
  3. CC. From Power Query Editor, remove the Content column.
  4. DD. From Power Query Editor, remove the Attribute column.
  5. EE. From Power BI Desktop, select Get Data, and then select Text/CSV.
  6. FF. From Power Query Editor, combine the Content column.
Show answer & explanation

Correct answer: Item 1: A · Item 2: C · Item 3: B

ExplanationA, C, B From Power BI Desktop, select Get Data, and then select Folder. From Power Query Editor, remove the Content column. From Power Query Editor, expand the Attributes column.

QUESTION 16

A business intelligence (BI) developer creates a dataflow in Power BI that uses DirectQuery to access tables from an on-premises Microsoft SQL server. The
Enhanced Dataflows Compute Engine is turned on for the dataflow.
You need to use the dataflow in a report. The solution must meet the following requirements:
✑ Minimize online processing operations.
✑ Minimize calculation times and render times for visuals.
✑ Include data from the current year, up to and including the previous day.
What should you do?

  1. AA. Create a dataflows connection that has DirectQuery mode selected.
  2. BB. Create a dataflows connection that has DirectQuery mode selected and configure a gateway connection for the dataset.
  3. CC. Create a dataflows connection that has Import mode selected and schedule a daily refresh.
  4. DD. Create a dataflows connection that has Import mode selected and create a Microsoft Power Automate solution to refresh the data hourly.
Show answer & explanation

Correct answer: C

ExplanationA daily update is adequate.
When you set up a refresh schedule, Power BI connects directly to the data sources using connection information and credentials in the dataset to query for updated data, then loads the updated data into the dataset. Any visualizations in reports and dashboards based on that dataset in the Power BI service are also updated.
Reference:
https://docs.microsoft.com/en-us/power-bi/connect-data/refresh-desktop-file-local-drive

QUESTION 17

DRAG DROP
-

You publish a dataset that contains data from an on-premises Microsoft SQL Server database.

The dataset must be refreshed daily.

You need to ensure that the Power BI service can connect to the database and refresh the dataset.

Which four actions should you perform in sequence? To answer, move the appropriate actions from the list of actions to the answer area and arrange them in the correct order.
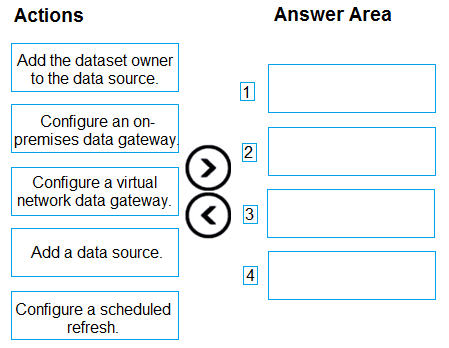
Item 1

  1. AA. Add the dataset owner to the data source.
  2. BB. Configure an on-premises data gateway.
  3. CC. Configure a virtual network data gateway.
  4. DD. Add a data source.
  5. EE. Configure a scheduled refresh.

Item 2

  1. AA. Add the dataset owner to the data source.
  2. BB. Configure an on-premises data gateway.
  3. CC. Configure a virtual network data gateway.
  4. DD. Add a data source.
  5. EE. Configure a scheduled refresh.

Item 3

  1. AA. Add the dataset owner to the data source.
  2. BB. Configure an on-premises data gateway.
  3. CC. Configure a virtual network data gateway.
  4. DD. Add a data source.
  5. EE. Configure a scheduled refresh.

Item 4

  1. AA. Add the dataset owner to the data source.
  2. BB. Configure an on-premises data gateway.
  3. CC. Configure a virtual network data gateway.
  4. DD. Add a data source.
  5. EE. Configure a scheduled refresh.
Show answer & explanation

Correct answer: Item 1: B · Item 2: D · Item 3: A · Item 4: E

Explanation

QUESTION 18

You attempt to connect Power BI Desktop to a Cassandra database.

From the Get Data connector list, you discover that there is no specific connector for the Cassandra database.

You need to select an alternate data connector that will connect to the database.

Which type of connector should you choose?

  1. AA. Microsoft SQL Server database
  2. BB. ODBC
  3. CC. OLE DB
  4. DD. OData
Show answer & explanation

Correct answer: B

Explanation

QUESTION 19

DRAG DROP
-

You receive annual sales data that must be included in Power BI reports.

From Power Query Editor, you connect to the Microsoft Excel source shown in the following exhibit.
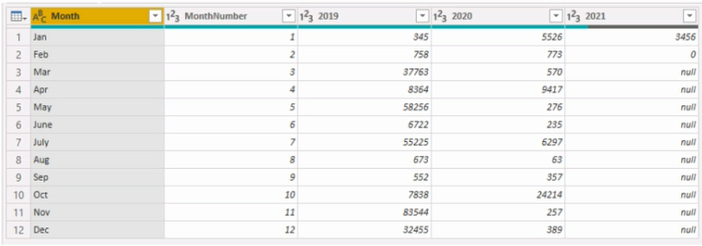


You need to create a report that meets the following requirements:

• Visualizes the Sales value over a period of years and months
• Adds a slicer for the month
• Adds a slicer for the year

Which three actions should you perform in sequence? To answer, move the appropriate actions from the list of actions to the answer area and arrange them in the correct order.
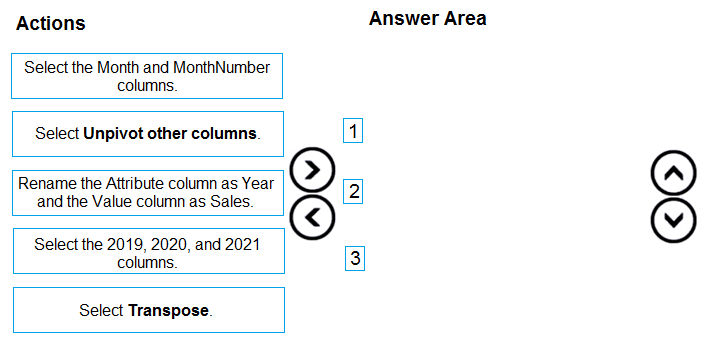
Item 1

  1. AA. Select the Month and MonthNumber columns.
  2. BB. Select Unpivot other columns.
  3. CC. Rename the Attribute column as Year and the Value calumn as Sales.
  4. DD. Select the 2019, 2020, and 2021 columns.
  5. EE. Select Transpose.

Item 2

  1. AA. Select the Month and MonthNumber columns.
  2. BB. Select Unpivot other columns.
  3. CC. Rename the Attribute column as Year and the Value calumn as Sales.
  4. DD. Select the 2019, 2020, and 2021 columns.
  5. EE. Select Transpose.

Item 3

  1. AA. Select the Month and MonthNumber columns.
  2. BB. Select Unpivot other columns.
  3. CC. Rename the Attribute column as Year and the Value calumn as Sales.
  4. DD. Select the 2019, 2020, and 2021 columns.
  5. EE. Select Transpose.
Show answer & explanation

Correct answer: Item 1: A · Item 2: B · Item 3: C

Explanation

QUESTION 20

HOTSPOT
-

You are using Power BI Desktop to connect to an Azure SQL database.

The connection is configured as shown in the following exhibit.
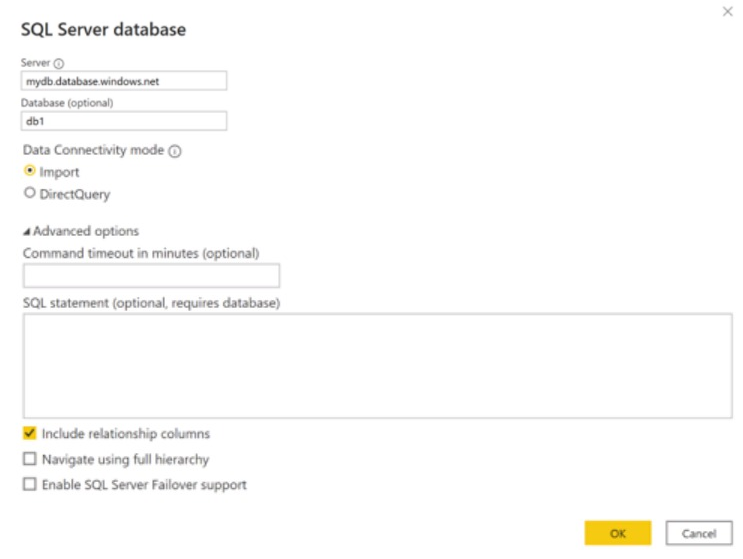


Use the drop-down menus to select the answer choice that completes each statement based on the information presented in the graphic.

NOTE: Each correct solution is worth one point.
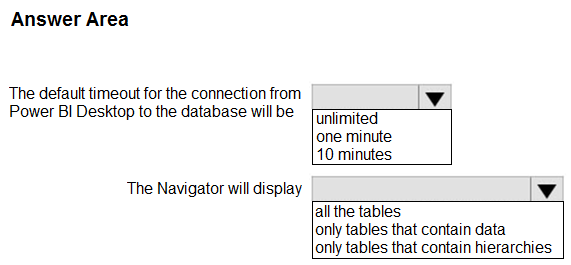
Item 1

  1. AA. unlimited
  2. BB. one minute
  3. CC. 10 minutes

Item 2

  1. AA. all the tables
  2. BB. only tables that contain data
  3. CC. only tables that contain hierarchies
Show answer & explanation

Correct answer: Item 1: C · Item 2: A

ExplanationThe defaut time out is 10 minutes, but if it takes more than it you can enter another value in minutes to keep the connection open longer.

1. 10 minutes
2. All the tables

Reference:
https://learn.microsoft.com/en-us/power-query/connectors/azuresqldatabase

Build a focused PL-300 practice routine.

Choose PL-300 in Revizo and work through original, question-by-question practice on your iPhone. Review results, revisit what needs attention and keep your next session tied to one specific certification objective.

Practise PL-300 with Revizo

PL-300 practice questions.

Is Revizo the official Microsoft exam?

No. Revizo is an independent iPhone app for certification practice. Refer to the provider's official resources for current exam policies and registration.

How should I use these PL-300 practice questions?

Use the exam code to select the matching certification in Revizo, then build short, focused sessions around the areas you want to review.

Are Revizo questions copied from live examinations?

No. Revizo provides original practice questions for certification study. Use the provider's official objectives, documentation and policies as the source of truth for your preparation.

What should I use alongside PL-300 practice questions?

Use the current Microsoft objectives, documentation and registration guidance as your source of truth. Revizo is designed to support focused practice, not replace the provider's official materials.

Where can I confirm current PL-300 requirements?

Check the official Microsoft exam page for the latest objectives, registration details and policies.