Revizo / Tableau / TDA-C01

TABLEAU CERTIFICATION STUDY GUIDE

TDA-C01 practice questions.
Prepare with a clearer plan.

Validates skills in data analysis and visualization using Tableau.

Download Revizo
Revizo certification practice question on iPhone

What to know about TDA-C01.

Validates skills in data analysis and visualization using Tableau.

Format
Multiple choice and hands-on questions
Duration
120 minutes
Passing score
750/1000
Recommended experience
6+ months of Tableau experience

Exam details are based on the available Tableau catalogue information. Confirm current requirements with the exam provider before booking.

How to prepare for TDA-C01.

Use the provider's current objectives as your source of truth, then organise your Revizo sessions around Tableau concepts, the exam format and the professional scenarios named in the certification. The TDA-C01 exam is listed as Multiple choice and hands-on questions; your starting point should reflect 6+ months of Tableau experience.

01

Map the official objectives.

Read the current Tableau objectives and make a short list of the areas you need to revisit before booking TDA-C01.

02

Practise one area at a time.

Select TDA-C01 in Revizo and use focused question sessions to test one topic or decision type at a time, rather than relying on a single long cram session.

03

Review, then repeat.

Use your results to return to incorrect answers, revisit the official material behind them and repeat short TDA-C01 practice sessions until the gaps are clearer.

FREE PRACTICE PREVIEW

Read the first 20
TDA-C01 questions.

Review each question, its correct answer and any available source explanation before continuing your certification study in Revizo.

FIRST 20 QUESTIONS

Answers & available explanations

QUESTION 1

You are the owner of an alert.
You receive an email notification that the alert was suspended.
From where can you resume the suspended alert?

  1. AA. The My Content area of Tableau web pages
  2. BB. The Data Source page of Tableau Desktop
  3. CC. The Notifications area of Tableau Prep
  4. DD. The Shared with Me page
Show answer & explanation

Correct answer: A

Explanation

QUESTION 2

You have the following data source in Tableau Server.
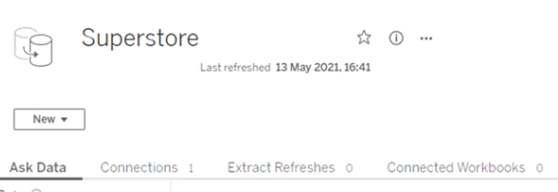
You need to ensure that the data is updated every hour.
What should you select?

  1. AA. Extract Refreshes
  2. BB. New
  3. CC. Connected Workbooks
  4. DD. Connections
Show answer & explanation

Correct answer: A

Explanation

QUESTION 3

You have the following tiled dashboard that has one sheet.
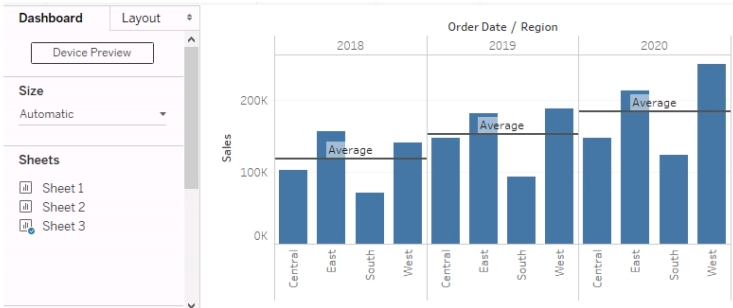
You want to replace the sheet with Sheet2.
What should you do?

  1. AA. Right-click Sheet2 and select Add to Dashboard
  2. BB. Select Sheet3 and click the Swap Sheet button next to Sheet2
  3. CC. From the context menu of Sheet3. select Remove Dashboard Item
  4. DD. Drag Sheet2 to the dashboard
  5. EE. From the context menu of Sheet3: select Deselect
Show answer & explanation

Correct answer: B

Explanation

QUESTION 4

You have the following primary data source that contains a dimension named Dorm_Code.
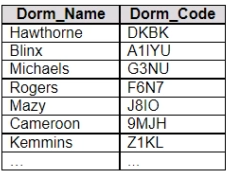
You receive the following secondary data source that contains updated dorm codes.
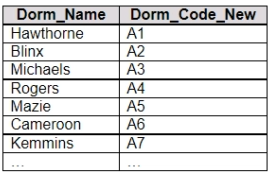
You need to bring the updated dorm codes into Tableau and use the codes in existing visualizations. The new dorm codes must use the existing field name of Dorm_Code.
What should you do?

  1. AA. Bring in the secondary data source as a union.
  2. BB. Bring in the secondary table as a left join to the primary data source. From the Data Source page select Create Calculated Field in the Dorm_Name field and enter [Dorm_Name_New] in the calculation window.
  3. CC. Bring in the secondary data source by using relationships. From the Data pane, right-click Dorm_Name. select Replace References and then select Dorm_Name_New.
  4. DD. Create a data blend and select Edit Primary Aliases to replace the primary data source alias values with values from the secondary data source.
Show answer & explanation

Correct answer: C

Explanation

QUESTION 5

You plan to create a visualization that has a dual axis chart. The dual axis chart will contain a shape chart and a line chart. Both charts will use the same measure named Population on the axis.
You need to configure the shapes to be much larger than the line.
What should you do?

  1. AA. Duplicate Population Drag the duplicate to the second Marks card and configure the size of the marks independently
  2. BB. For the second axis, select Shape on the Marks card. From Select Shape Palette, select Custom, and then select Reset
  3. CC. Create a custom shape that is larger than the default shape and add the shape to the Shapes folder in My Repository.
  4. DD. Change Population to a discrete dimension.
Show answer & explanation

Correct answer: A

Explanation

QUESTION 6

DRAG DROP -
Your company has two divisions located in the United States and Germany. Each division has a separate database.
The following is a sample of the sales data for the division in the United States.

The following is a sample of the sales data for the division in Germany.

You have population data in a file named Population.csv. The following is a sample of the data.
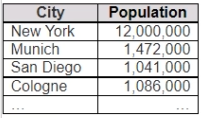
You plan to create a visualization that will show the sales per capita for each salesperson. Each salesperson must be identified by their full name.
You need to prepare the data to support the planned visualization. The data source must support being published.
Which four actions should you perform in order?
(Place the four correct options in order Use the arrows to move Options to Answer Area. Use Answer Area arrows to re-order the options.)
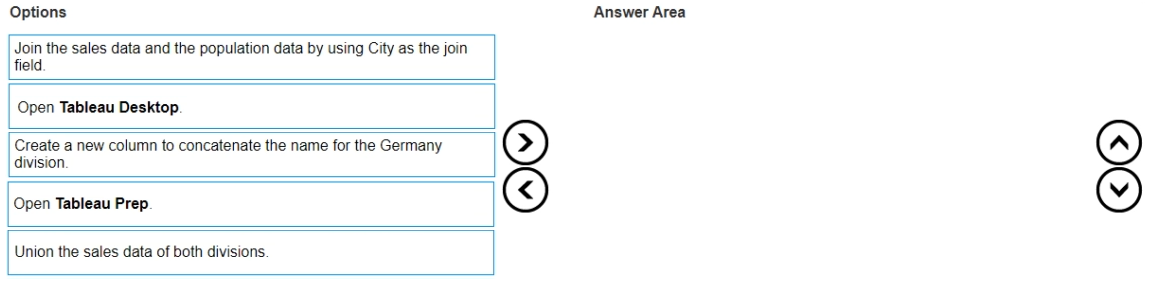
Item 1

  1. AA. Join the sales data and the population data by using City as the join field.
  2. BB. Open Tableau Desktop.
  3. CC. Create a new column to concatenate the name for the Germany division.
  4. DD. Open Tableau Prep.
  5. EE. Union the sales data of both divisions.

Item 2

  1. AA. Join the sales data and the population data by using City as the join field.
  2. BB. Open Tableau Desktop.
  3. CC. Create a new column to concatenate the name for the Germany division.
  4. DD. Open Tableau Prep.
  5. EE. Union the sales data of both divisions.

Item 3

  1. AA. Join the sales data and the population data by using City as the join field.
  2. BB. Open Tableau Desktop.
  3. CC. Create a new column to concatenate the name for the Germany division.
  4. DD. Open Tableau Prep.
  5. EE. Union the sales data of both divisions.

Item 4

  1. AA. Join the sales data and the population data by using City as the join field.
  2. BB. Open Tableau Desktop.
  3. CC. Create a new column to concatenate the name for the Germany division.
  4. DD. Open Tableau Prep.
  5. EE. Union the sales data of both divisions.
Show answer & explanation

Correct answer: Item 1: D · Item 2: C · Item 3: E · Item 4: A

Source explanation is not available for this question.

QUESTION 7

DRAG DROP -
You have the following dataset.
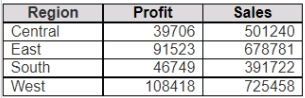
You need to create the following worksheet.
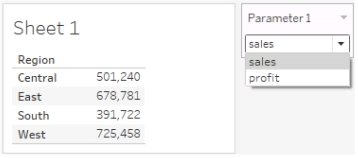
The table must show either profit or sales based on the selection from the Parameter 1 menu.
Which three actions should you perform in order?
(Place the three correct options in order. Use the arrows to move Options to Answer Area. Use Answer Area arrows to re-order the options.)
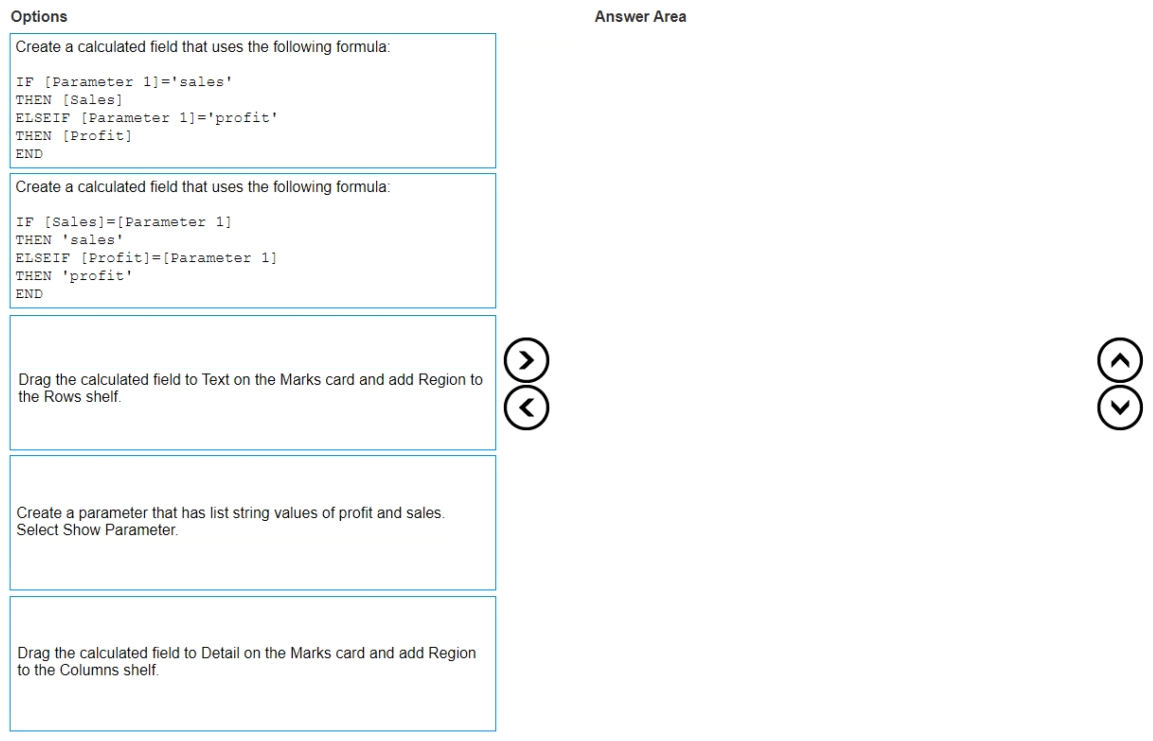
Item 1

  1. AA. Create a calculated field that uses the following formula: IF [Parameter 1]='sales' THEN [Sales] ELSEIF [Parameter 1]='profit' THEN [Profit] END
  2. BB. Create a calculated field that uses the following formula: IF [Sales]=[Parameter 1] THEN 'sales' ELSEIF [Profit]=[Parameter 1] THEN 'profit' END
  3. CC. Drag the calculated field to Text on the Marks card and add Region to the Rows shelf.
  4. DD. Create a parameter that has list string values of profit and sales. Select Show Parameter.
  5. EE. Drag the calculated field to Detail on the Marks card and add Region to the Columns shelf.

Item 2

  1. AA. Create a calculated field that uses the following formula: IF [Parameter 1]='sales' THEN [Sales] ELSEIF [Parameter 1]='profit' THEN [Profit] END
  2. BB. Create a calculated field that uses the following formula: IF [Sales]=[Parameter 1] THEN 'sales' ELSEIF [Profit]=[Parameter 1] THEN 'profit' END
  3. CC. Drag the calculated field to Text on the Marks card and add Region to the Rows shelf.
  4. DD. Create a parameter that has list string values of profit and sales. Select Show Parameter.
  5. EE. Drag the calculated field to Detail on the Marks card and add Region to the Columns shelf.

Item 3

  1. AA. Create a calculated field that uses the following formula: IF [Parameter 1]='sales' THEN [Sales] ELSEIF [Parameter 1]='profit' THEN [Profit] END
  2. BB. Create a calculated field that uses the following formula: IF [Sales]=[Parameter 1] THEN 'sales' ELSEIF [Profit]=[Parameter 1] THEN 'profit' END
  3. CC. Drag the calculated field to Text on the Marks card and add Region to the Rows shelf.
  4. DD. Create a parameter that has list string values of profit and sales. Select Show Parameter.
  5. EE. Drag the calculated field to Detail on the Marks card and add Region to the Columns shelf.
Show answer & explanation

Correct answer: Item 1: D · Item 2: A · Item 3: C

Explanation

QUESTION 8

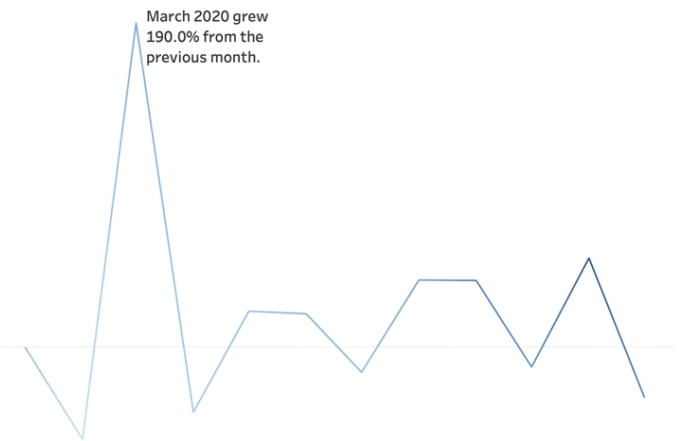
You have a line chart on a worksheet.
You want to add a comment to March 2020 as shown in the following visualization.
What should you do?

  1. AA. Drag the growth rate to Text on the Marks card.
  2. BB. Add a tooltip.
  3. CC. Annotate March 2020.
  4. DD. Enable captions.
Show answer & explanation

Correct answer: C

Explanation

QUESTION 9

You have the following dataset.

You need to create the following visualization.
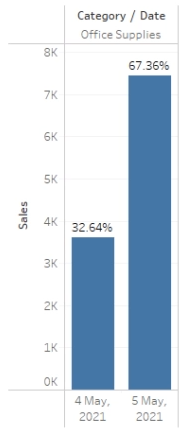
Which quick table calculation should you drag to Text on the Marks card?

  1. AA. Percent of Total
  2. BB. Percent Difference
  3. CC. Compound Growth Rate
  4. DD. Percentile
Show answer & explanation

Correct answer: A

Explanation

QUESTION 10

A colleague provides you with access to a folder that contains the following files:

Sales.csv -

Book1.twb -

Sales.hyper -

Export.mdb -
Which file contains an extract?

  1. AA. Export.mdb
  2. BB. Sales.hyper
  3. CC. Book1.twb
  4. DD. Sales.csv
Show answer & explanation

Correct answer: B

Explanation

QUESTION 11

You have the following sets in a Tableau workbook:

Top N Customers -

Customers of 2020 -

Top N Products -

Sellers of 2020 -
Which two sets can you combine? (Choose two.)

  1. AA. Top N Customers
  2. BB. Sellers of 2020
  3. CC. Customers of 2020
  4. DD. Top N Products
Show answer & explanation

Correct answer: A, C

Explanation

QUESTION 12

You create the following worksheet.
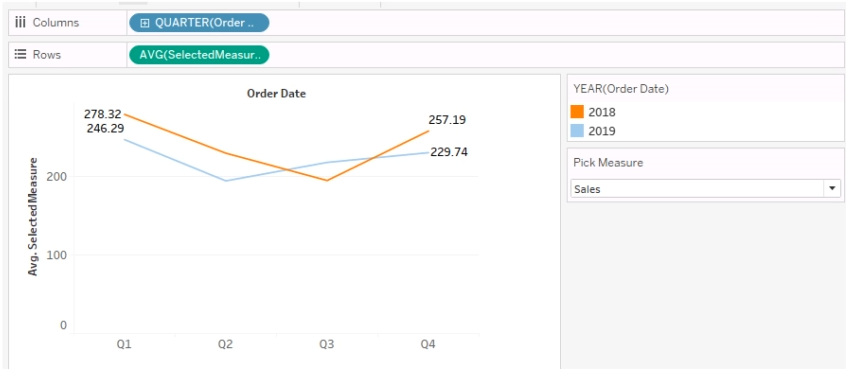
The Pick Measure parameter contains the following list of values.
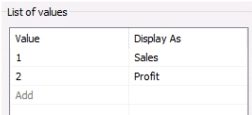
Users can select a value from Pick Measure to change the visualization to show either the Sales measure or the Profit measure.
Which formula is used in the SelectedMeasure calculated field to switch between measures?

  1. AA.
  2. BB.
  3. CC.
  4. DD.
Show answer & explanation

Correct answer: A

Explanation

QUESTION 13

HOTSPOT -
You have a Tableau Prep flow that joins a dataset named Global Indicators to a dataset named Price Indices.
In which step can you transform rows of monthly data into rows of yearly data?
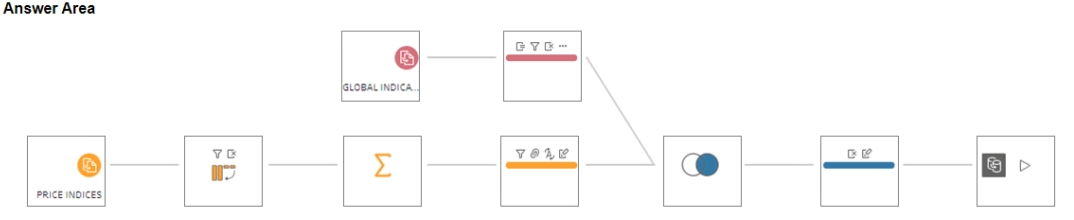
    Show answer & explanation

    Correct answer:

    Explanation

    QUESTION 14

    You have the following dataset.
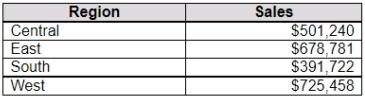
    Which Level of Detail (LOD) expression should you use to calculate the grand total of all the regions?

    1. AA. { FIXED [Region]: SUM(Sales) }
    2. BB. { FIXED : SUM(Sales) }
    3. CC. { FIXED [Region]: TOTAL(Sales) }
    4. DD. { FIXED : TOTAL(Sales) }
    Show answer & explanation

    Correct answer: B

    Explanation

    QUESTION 15

    You publish a dashboard that uses an extract. The extract refreshes every Monday at 10:00.
    You need to ensure that the extract also refreshes on the last day of the month at 18:00.
    What should you do?

    1. AA. From Tableau Server, select the workbook, select Refresh Extracts, and then add a new extract refresh.
    2. BB. From Tableau Server, select Schedules, and change the priority of the existing schedule.
    3. CC. From Tableau Desktop, open the Publish Workbook dialog box and configure the schedule.
    4. DD. From Tableau Server, select Schedules, find the schedule of the extract, and change the frequency to the last day of the month.
    Show answer & explanation

    Correct answer: A

    Explanation

    QUESTION 16

    You have the following dashboard.
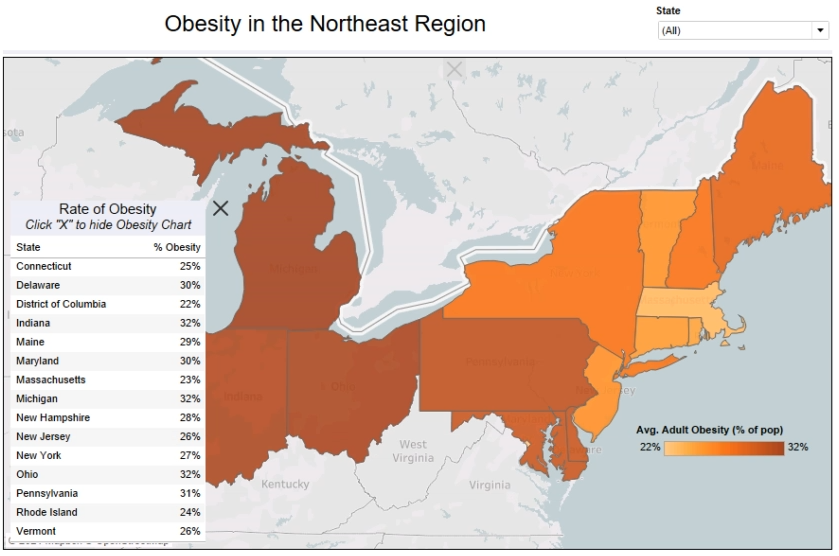
    Which two elements are floating? (Choose two.)

    1. AA. The title
    2. BB. The color legend
    3. CC. The map
    4. DD. The Rate of Obesity chart
    5. EE. The state filter
    Show answer & explanation

    Correct answer: B, D

    Explanation

    QUESTION 17

    HOTSPOT -

    You have the following dashboard.
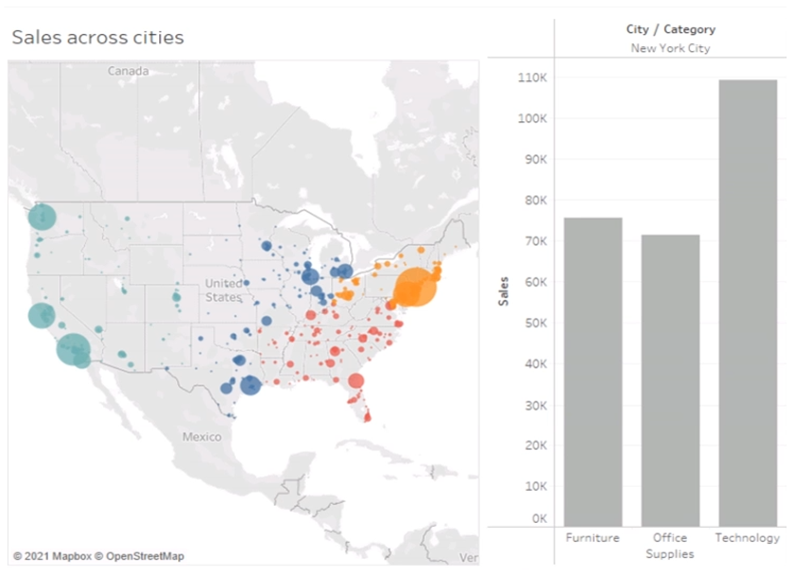


    When a user selects a city on the map, the data on the bar chart must show only the data for the selected city. The data in the bar chart must change only when the user selects a different city.

    How should you configure the dashboard action? (Use the dropdowns in the Answer Area to select the correct options.)
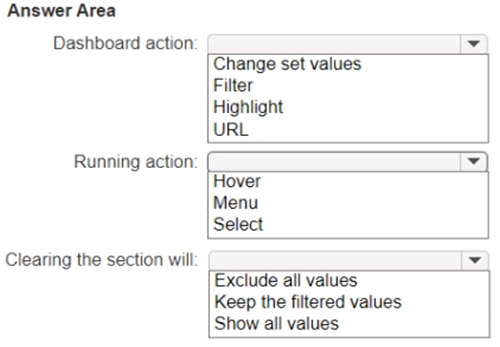
    Item 1

    1. AA. Change set values
    2. BB. Filter
    3. CC. Highlight
    4. DD. URL

    Item 2

    1. AA. Hover
    2. BB. Menu
    3. CC. Select

    Item 3

    1. AA. Exclude all values
    2. BB. Keep the filtered values
    3. CC. Show all values
    Show answer & explanation

    Correct answer: Item 1: B · Item 2: C · Item 3: B

    ExplanationShow all values is wrong, as condition is to change the bar chart data when clicking on different city, which is only possible with Keep All Values. Show all values allows deselction of filter when clicking on same city again.

    QUESTION 18

    You have the following dashboard that contains two visualizations.
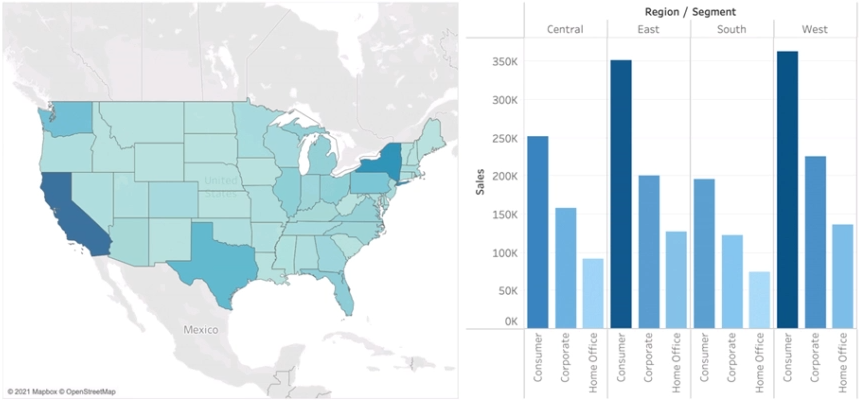
    You want to show only one visualization at time. Users must be able to switch between visualizations.
    What should you use?

    1. AA. Dashboard actions
    2. BB. Show/hide buttons
    3. CC. A parameter and a calculated field
    4. DD. Worksheet actions
    Show answer & explanation

    Correct answer: C

    Explanation

    QUESTION 19

    You have a dashboard that contains confidential information about patients’ health.
    The data needs to always be up to date for a team of healthcare workers.
    How should you share the dashboard with the healthcare workers?

    1. AA. Export the dashboard as a .twbx
    2. BB. Publish the dashboard to Tableau Public
    3. CC. Publish the dashboard to Tableau Server
    4. DD. Print the dashboard to PDF
    Show answer & explanation

    Correct answer: C

    Explanation

    QUESTION 20

    You need to change the values of a dimension without creating a new field.
    What should you do?

    1. AA. Rename the fields.
    2. BB. Create aliases.
    3. CC. Create groups.
    4. DD. Transforms the fields.
    Show answer & explanation

    Correct answer: B

    Explanation

    Build a focused TDA-C01 practice routine.

    Choose TDA-C01 in Revizo and work through original, question-by-question practice on your iPhone. Review results, revisit what needs attention and keep your next session tied to one specific certification objective.

    Practise TDA-C01 with Revizo

    TDA-C01 practice questions.

    Is Revizo the official Tableau exam?

    No. Revizo is an independent iPhone app for certification practice. Refer to the provider's official resources for current exam policies and registration.

    How should I use these TDA-C01 practice questions?

    Use the exam code to select the matching certification in Revizo, then build short, focused sessions around the areas you want to review.

    Are Revizo questions copied from live examinations?

    No. Revizo provides original practice questions for certification study. Use the provider's official objectives, documentation and policies as the source of truth for your preparation.

    What should I use alongside TDA-C01 practice questions?

    Use the current Tableau objectives, documentation and registration guidance as your source of truth. Revizo is designed to support focused practice, not replace the provider's official materials.

    Where can I confirm current TDA-C01 requirements?

    Check the official Tableau exam page for the latest objectives, registration details and policies.